Many developers assume that if a Figma plugin throws no visible error inside the plugin window, nothing went wrong. That assumption is wrong, and it causes a specific kind of wasted time: you stare at a plugin that silently does nothing, with no message anywhere, because the exception was swallowed by an async boundary or lost across an isolation boundary. The Figma plugin runtime does not surface every failure in the same place, and knowing which console to open for which failure is most of the debugging work.
This guide is organized in two passes. The first pass covers what a developer new to Figma plugins needs to see errors at all. The second pass covers what to do when the standard console is empty and the failure is happening in a place the default tools do not reach.
Part One: The Beginner Path
Where Plugin Errors Go
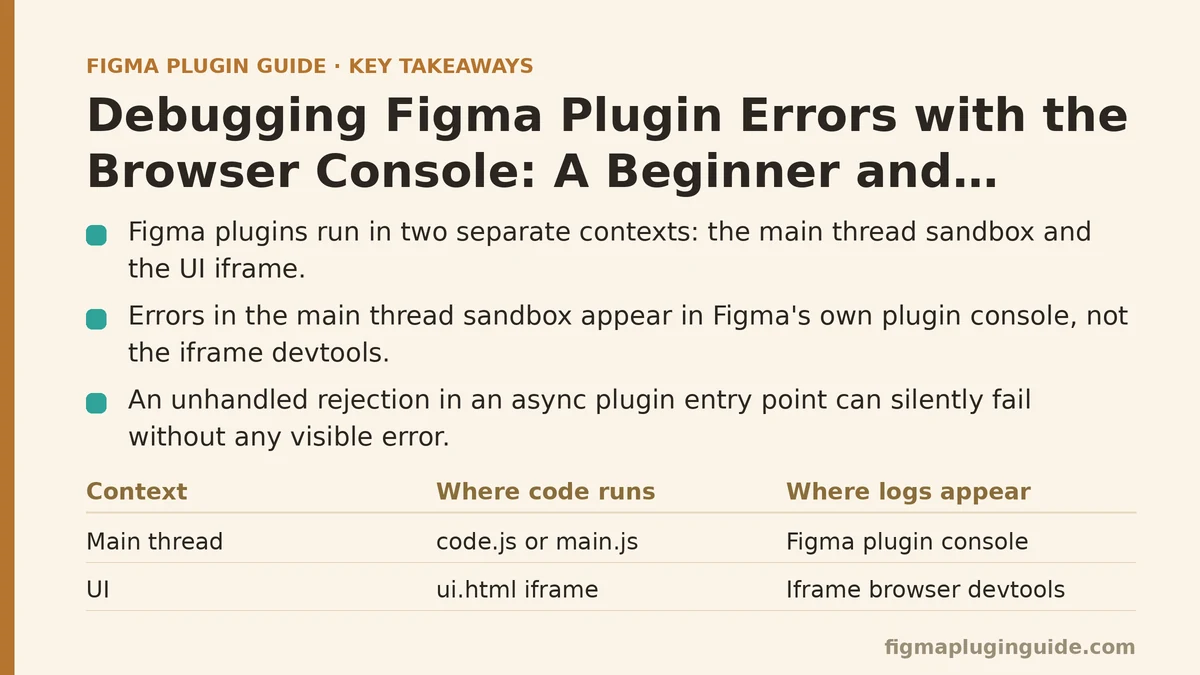
A Figma plugin runs across two execution contexts, and this split is the single most important fact for debugging:
- The main thread (
code.js/main.js) — the sandboxed environment where you call thefigmaAPI. This is not the browser’s main thread. It is an isolated JavaScript context provided by Figma. - The UI (
ui.html) — an iframe that holds your HTML, CSS, and any UI-side JavaScript. This context behaves much like a normal web page.
Errors in the first context do not appear in the second, and vice versa. A beginner opens the plugin’s own UI panel, sees nothing, and concludes the code is fine. In practice, the exception was thrown in the sandbox, and the sandbox console is somewhere else entirely.
Opening the Right Console
For the UI iframe, right-click inside the plugin’s window and choose “Inspect” if the menu offers it. In current Figma desktop builds, the reliable path is through the developer tools at Plugins → Development → Open console or, for the iframe specifically, the browser-style devtools panel.
For the main thread sandbox, the console output lands in Figma’s own console — a separate panel from the iframe devtools. If you have ever logged something from the plugin’s code.js and not seen it, this is why. The message went to a console you were not looking at.
A quick rule: console.log inside your UI code appears in the iframe devtools. console.log at the top level of code.js appears in Figma’s plugin console. If you move a log statement between the two files and it “disappears,” nothing is broken — you are looking at the wrong panel.
Wrapping Your Entry Point
The most common beginner failure is an unhandled rejection in an async plugin entry point. If your plugin’s top-level function is async and something throws inside it, the error can resolve into a rejected promise that nothing awaits, and the plugin simply closes or freezes with no message.
The fix is a defensive wrapper at the entry point:
// code.js — top of file, before anything else runs
(async function run() {
  try {
    await main();
  } catch (err) {
    // Surface the error in the sandbox console with a stack trace
    console.error('[plugin] unhandled error:', err);
    // Also forward it to the UI so it is visible without devtools open
    figma.ui.postMessage({
      type: 'plugin-error',
      message: err && err.message ? err.message : String(err),
      stack: err && err.stack ? err.stack : null,
    });
    figma.notify('Plugin error: ' + (err && err.message ? err.message : 'unknown'), {
      error: true,
    });
  }
})();
On the UI side, listen for that message and log it so both consoles show the same failure:
// ui.html — inside a <script> block
window.onmessage = (event) => {
  const msg = event.data.pluginMessage;
  if (!msg) return;
  if (msg.type === 'plugin-error') {
    console.error('[ui received]', msg.message);
    if (msg.stack) console.error(msg.stack);
  }
};
The figma.notify call with { error: true } is the part that makes the failure impossible to miss during a demo, even with devtools closed. For a shipped plugin you may want to log without notifying — an error toast in front of a user is worse than a silent log you can retrieve later.
A Concrete Diagnostic Sequence
When a plugin does nothing after you click a button, work through this order rather than guessing:
- Open the UI iframe devtools. Look for a red error. If one exists, the failure is in the UI layer.
- Open Figma’s plugin console (separate panel). Look for a red error there. If one exists, the failure is in the sandbox.
- If both are empty, add a
console.log('step 1')at the top of your entry function and another after eachawait. Redeploy (see the next section) and click again. - Identify the last log that printed. The failure is between that log and the next expected one.
The fourth step is the one beginners skip, and it is the fastest way to localize an async bug.
You Must Re-Run, Not Just Save
Editing code.js does not hot-reload. Every change requires you to close and re-run the plugin from Plugins → Development → Your Plugin. A common trap is editing a file, saving, and re-triggering the plugin’s command — which runs the previous build if you have a bundler step, or the previous cached file if you do not. If a fix “did nothing,” confirm the plugin was re-invoked after the change.
Part Two: The Advanced Path
Once you can see errors at all, the harder class of bug appears: failures that produce no console output because they occur inside a boundary the standard tools do not cross, or because the error is a TypeError from undefined that tells you nothing about which API call caused it.
Scenario 1: The Error Is in the Sandbox, Not the Iframe
The sandbox has a restricted API surface. It has no DOM, no window, no document. Code that assumes a browser environment will throw ReferenceError: window is not defined — but only in the sandbox, where you may not be looking.
A reliable way to separate the two contexts is to prefix every log with its origin:
// code.js
const log = (...args) => console.log('[sandbox]', ...args);
log('created node', node.id);
// ui.html
const log = (...args) => console.log('[iframe]', ...args);
log('received selection', count);
When you scroll a merged view of both consoles, the prefix tells you instantly which environment produced the message. Without it, identical-looking logs from two contexts become indistinguishable during a debugging session.
Scenario 2: postMessage Payloads That Fail Silently
The figma.ui.postMessage / window.onmessage channel serializes its payload. Non-serializable values — Map, Set, class instances, DOM nodes, functions — are dropped or replaced without a thrown error. The receiving side gets a message whose fields are missing, and the subsequent code throws a confusing TypeError that points at the wrong line.
Before sending anything across the boundary, force it through a JSON round-trip in development so the failure happens at the point of the bug:
// code.js — development-only guard
function safePost(payload) {
  let serializable;
  try {
    serializable = JSON.parse(JSON.stringify(payload));
  } catch (err) {
    console.error('[sandbox] payload is not serializable:', err, payload);
    throw err;
  }
  figma.ui.postMessage(serializable);
}
The trade-off is real: the round-trip costs performance and strips types you might have wanted to preserve, so it belongs behind a development flag and not in the shipped path. But the cost of a stripped Map crossing into the UI as an empty object is a bug that looks like a UI problem when it is a serialization problem.
Scenario 3: Tracing Async Operations Without a Stack
Figma plugin async work frequently loses its call stack. A promise rejection swallowed deep inside a chain logs only the rejection message, with no indication of which await produced it. When a stack is unavailable, a token-based trace is the fallback:
// code.js
let traceId = 0;
async function trace(label, fn) {
  const id = ++traceId;
  console.log(`[sandbox] trace ${id} enter: ${label}`);
  try {
    const result = await fn();
    console.log(`[sandbox] trace ${id} ok: ${label}`);
    return result;
  } catch (err) {
    console.error(`[sandbox] trace ${id} fail: ${label}`, err);
    throw err;
  }
}

// usage
const nodes = await trace('load selection', () => figma.currentPage.selection.slice());
const updated = await trace('apply grid layout', () => applyGrid(nodes));
The console output becomes a sequential log you can read as a narrative. When a step fails, its trace id is the last one printed before the error, localizing the failure without needing a stack. The overhead is negligible for plugin-scale operations and worth leaving in during development.
Scenario 4: The Real API Rejects an Argument the Mock Accepted
If tests run against a mocked figma global (as they commonly do in CI), the mock can pass arguments the real API rejects. The result is a failure that reproduces only in the live plugin, not in the test suite. Common culprits include passing a null node to setRangeFontName, or calling loadFontAsync with a family name the environment does not have installed.
The fix is a validation layer that asserts arguments before they reach the API, so the error message names the offending value rather than the API’s generic rejection:
// code.js
function assertNode(node) {
  if (!node || typeof node.id !== 'string') {
    throw new Error(`Expected a node, received: ${JSON.stringify(node)}`);
  }
  return node;
}

async function setText(node, value) {
  assertNode(node);
  if (typeof value !== 'string') {
    throw new Error(`setText expects a string, received: ${typeof value}`);
  }
  await figma.loadFontAsync(node.fontName);
  node.characters = value;
}
This is not defensive programming for its own sake. It is a debugging aid: an error message that says “received null” is far more actionable than a downstream API error that says “invalid argument.” The trade-off is code length — every wrapped call costs a few lines — which is why validation is typically applied at the boundaries between your logic and the figma global, not on every helper.
Scenario 5: When to Reach for the Full Devtools Instead
For UI-heavy debugging, the iframe’s devtools give you the Elements panel, the Network panel, and breakpoints — all unavailable in the sandbox console. If the bug is in the UI’s rendering, use the iframe devtools. If the bug is in figma API calls, use the sandbox console. They overlap only at the postMessage boundary, which is why tracing across that boundary is the single most useful debugging skill for plugin authors.
The one case where you should not reach for devtools at all: when the plugin fails only on a collaborator’s machine or in a different Figma account, and no devtools are available there. In that situation, figma.notify and a persisted error log inside the plugin’s data storage are the only observability you have, and you should build them in before you need them.
Beginner vs Advanced: A Side-by-Side Reference
| Dimension | Beginner Approach | Advanced Approach |
|---|---|---|
| Where to look for errors | Plugin UI window | Sandbox console + iframe devtools, separately |
| Handling thrown exceptions | Read the red text | Wrap entry point, forward via postMessage |
| Async localization | Guess at the failing await | Token-based trace with sequential ids |
postMessage bugs | Assume the payload survived | Force JSON round-trip in development |
| API argument errors | Trust the API’s error message | Validate at the boundary with named values |
| Missing information | Re-run and hope | figma.notify + persisted log for shipped plugins |
What Each Approach Costs You
The beginner path is faster to learn and sufficient for most local development. It breaks down at exactly the moment a plugin ships and the failure appears on someone else’s machine, where you cannot open the sandbox console. The advanced path adds overhead — wrapper functions, trace utilities, validation layers — that is only worth paying once you are debugging across environments or across the sandbox/iframe boundary with any frequency.
The costs are concrete. Every wrapper is code you maintain. Every validation layer is a line of logic you can introduce a bug into. Every figma.notify on an error is a user-facing interruption. The discipline is to add the advanced techniques where the failure mode is invisible by default — the boundary, the async chain, the non-serializable payload — and leave the rest of the code alone.
Closing Diagnostic
If your plugin fails silently again, run this check in order before adding any logging: open the iframe devtools, open the sandbox console, confirm you re-ran the plugin after the last edit, and only then ask whether the failure crossed a boundary. In most plugins, the answer to “where did the error go” is one of those four questions, and the console that answers it is the one you were not looking at.
Which of these contexts — sandbox, iframe, or the postMessage boundary between them — is where your current plugin errors are appearing? That location determines which console to open first.
Related guides: Beginner Step-by-Step Guide to Creating a Figma Plugin UI with HTML/CSS, A Beginner’s Guide to Building Your First Figma Plugin from Scratch, and Figma Plugin Dark Mode Support Guide.