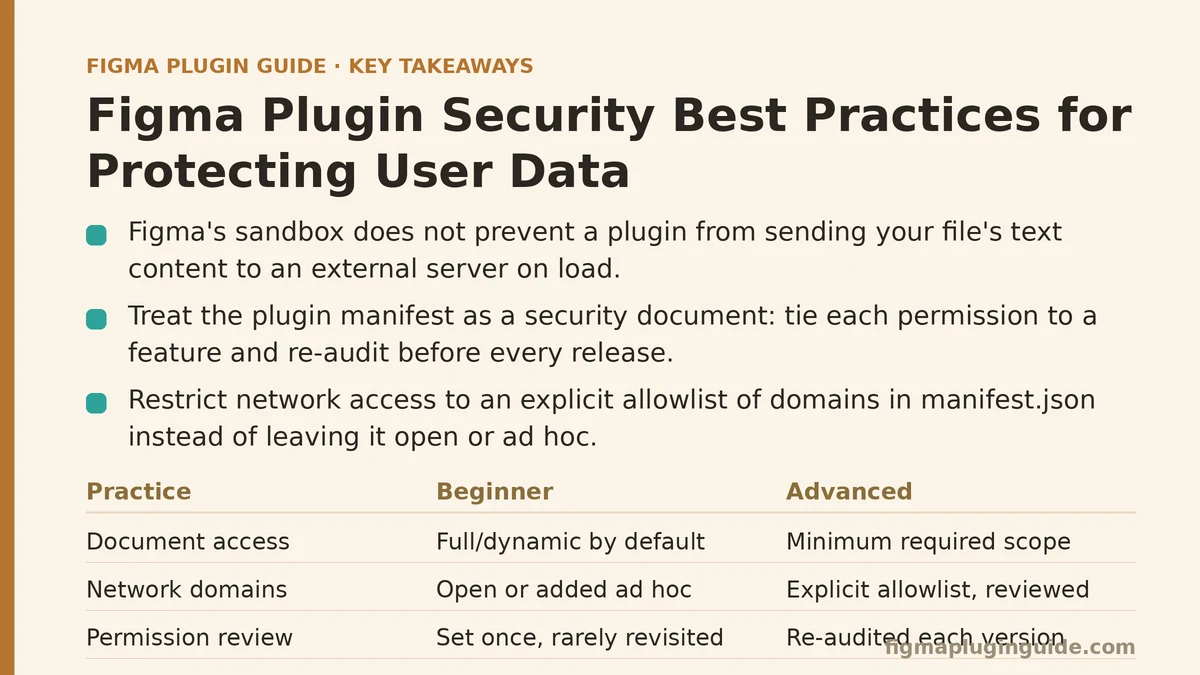
Figma’s plugin sandbox does not stop a plugin from sending your file’s text content to an external server the moment it loads. That capability exists by design, because plugins need network access to do useful things like fetch stock photos or sync with a CMS. The sandbox restricts what a plugin can touch inside Figma itself, not what it does with the data once that data leaves the canvas. Plenty of plugin developers build for months before they understand that distinction clearly.
This matters more than it used to. Design files now routinely contain customer names, unreleased product details, internal financial figures, and screenshots of production data pulled in for realistic mockups. A plugin with network access and a copy-paste habit toward an external API is handling all of that, whether or not its developer thought of it that way. What follows is a comparison of how beginner-level plugin development treats security versus how more careful, advanced practice treats the same problems — because the gap between the two is where most avoidable incidents happen.
Requesting Permissions: Convenience First vs. Least Privilege
A beginner plugin manifest often requests the broadest scope available, early in development, and just leaves it there. It’s faster to build against "documentAccess": "dynamic-page" and full network access from the start than to figure out the minimum required for each feature. Nobody audits the manifest again once the plugin ships, because it works.
An advanced approach treats the manifest as a security document, not a configuration afterthought. Each permission gets tied to a specific feature, and the developer revisits that list before every release, asking whether a given scope is still needed or was left over from a feature that got cut. Network access, in particular, gets restricted to an explicit allowlist of domains in manifest.json rather than left open, so the plugin can only reach the endpoints it’s supposed to reach — not whatever a future dependency update decides to call.
| Practice | Beginner Approach | Advanced Approach |
|---|---|---|
| Document access | Requests full/dynamic access by default | Scoped to the minimum the feature requires |
| Network domains | Open, unrestricted, or added ad hoc | Explicit allowlist, reviewed each release |
| Permission review | Set once at project start, rarely revisited | Re-audited before every version bump |
Handling Data in Transit: Assuming HTTPS Is Enough vs. Verifying the Whole Path
Sending data over HTTPS feels like a solved problem, and for the connection itself, it largely is. A beginner setup stops there — the request goes to https://, so the box gets checked, and the developer moves on to the next feature.
Advanced practice goes a step further and asks what happens on the other end of that connection. Is the endpoint one the developer controls, or a third-party service whose data-handling terms nobody on the team has actually read? Is the payload trimmed to only what’s needed, or does it include an entire node tree when three string fields would do? A plugin that exports full document JSON to log a single user action is transmitting far more than the feature requires, and every extra field is something that has to be secured, retained appropriately, and eventually deleted somewhere downstream.
Beginner habit: Send the full object because it’s already in memory and slicing it feels like unnecessary work.
Advanced habit: Serialize only the specific fields the feature needs, and treat “we already have the data in memory” as a reason to be more careful, not less.
Storing Data: Local Storage by Default vs. Deliberate Retention Policy
Figma’s clientStorage API is convenient, and beginner plugins tend to use it as a catch-all — user preferences, cached API responses, sometimes fragments of design content, all stored without much thought about what happens to that data over time or whether it needs to persist at all.
Advanced plugin development treats storage as something with a lifecycle. Data gets a defined retention period. Anything cached gets invalidated on a schedule rather than accumulating indefinitely. And there’s a meaningful distinction drawn between storage that’s genuinely local to the user’s machine versus data that gets synced to a plugin’s backend — because the second category carries obligations the first doesn’t, particularly if the plugin has any European or California-based users subject to GDPR or CCPA.
A short but useful test: if this plugin were audited tomorrow, could the developer explain, in one sentence per data type, why each piece of stored information exists and how long it’s kept? Beginner setups usually cannot answer that cleanly. Advanced ones can, because the answer was decided before the storage call was written, not after someone asked.
Third-Party Dependencies: Trusting npm by Default vs. Auditing the Supply Chain
Every plugin built with modern tooling pulls in dependencies, and most of those dependencies pull in their own. A beginner project runs npm install, sees no errors, and considers the dependency tree a solved problem. It rarely is.
Supply chain compromises in the JavaScript ecosystem are not hypothetical — packages have been hijacked and updated with malicious code that only surfaces after a version bump. A plugin bundling third-party code without scrutiny inherits whatever that code does with the data passing through it, including data the plugin has permission to access inside a Figma file.
Advanced practice runs dependency audits as a routine step, not a one-time setup task — npm audit or an equivalent tool before each release, dependencies pinned to specific versions rather than open ranges, and a habit of reading the changelog before accepting a major version bump from a package with access to sensitive parts of the codebase. It’s slower. It’s also the difference between catching a compromised package in a five-minute review and finding out about it from an affected user three weeks later.
Code Review and Distribution: Ship and Forget vs. Ongoing Verification
Once a plugin is published to the Figma Community, a beginner mindset treats that as the finish line. The plugin works, users install it, and attention moves to the next feature request.
Advanced teams treat publication as the start of an ongoing obligation. Code gets reviewed again after significant updates, not just before the first release. Access tokens and API keys are rotated on a schedule instead of left in place indefinitely. And critically, the plugin’s actual behavior — what it sends, where, and how often — gets periodically checked against what the manifest and privacy documentation claim it does. Drift between stated behavior and actual behavior tends to creep in gradually, usually through a dependency update or a feature added under time pressure, rather than through any deliberate decision to overreach.
A Side-by-Side Summary
| Security Area | Beginner Default | Advanced Practice |
|---|---|---|
| Manifest permissions | Broad access requested upfront | Scoped per feature, re-audited each release |
| Network requests | Open domains, full payloads | Allowlisted domains, minimal payloads |
| Local storage | Catch-all, indefinite retention | Defined lifecycle, deliberate invalidation |
| Dependencies | Installed and left unmonitored | Audited before each release |
| Post-launch behavior | Ship once, revisit rarely | Ongoing review against stated behavior |
Where This Leaves Plugin Developers
None of this requires exotic tooling or a dedicated security team. It requires treating each of the categories above as a question asked repeatedly over a plugin’s life, rather than a checkbox ticked once during initial development. The plugins that end up in security incidents are rarely the ones built by developers trying to do something malicious — they’re the ones where a reasonable early decision (broad permissions, an unaudited dependency, an open storage policy) never got revisited as the plugin’s user base and data exposure grew.
If you’re maintaining a plugin right now, pick one row from the summary table above and check it against your current manifest and codebase today. That single check tends to surface more than a full rewrite would, and it costs a fraction of the time. Related guides: Best Figma Plugins for Accessibility Checking, Figma Plugin Code Review Checklist: The Common Mistakes That Slip Through, and Figma Plugin Performance Optimization Tips.